30 Years of Australian Property Prices
What three decades of data reveals about cycles, crashes, and the cities that quietly changed the map.
Most property discussions focus on the last two or three years. That framing is almost always misleading. The real story of Australian housing only becomes visible when you zoom out far enough to see the full cycle: the booms that seemed unstoppable, the corrections that frightened everyone, and the recoveries that followed regardless.
The interactive chart below draws on 30 years of REIA, ABS, Domain, and CoreLogic data. Every major event is marked. Every city tells a different story. Use the controls to explore the view that interests you most, then read the era-by-era breakdown below.
Click any ◆ event marker to see what happened at that moment
Sources: REIA Real Estate Market Facts; ABS House Price Indexes (6416.0); Domain Quarterly Reports; CoreLogic/Cotality Home Value Index. Some data points between confirmed anchor years are interpolated estimates.
Five eras. Five different markets.
The 30-year chart only makes sense when broken into the cycles that shaped it. Each era arrived with its own dominant narrative, and its own version of “this time it’s different.”
Everyone boomed together
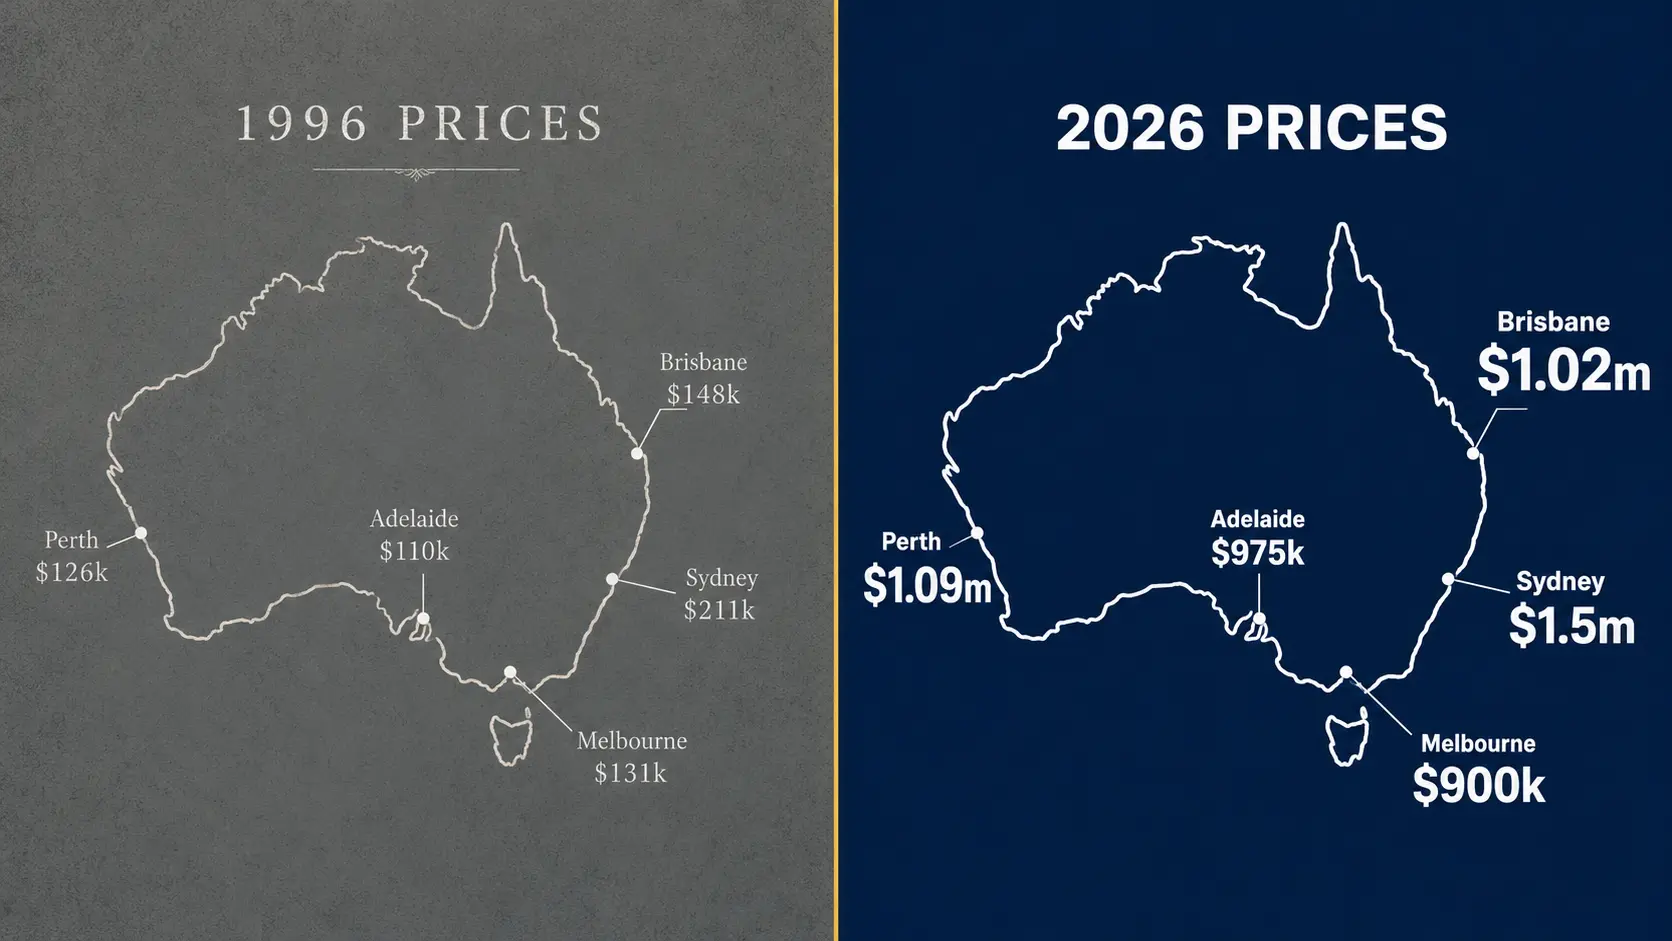
After the recession of the early 1990s and a period of 17% mortgage rates, falling interest rates unlocked a decade of broad-based growth. The introduction of the GST in 2000 created a pre-GST buying rush, then a brief dip, then a sustained boom as the RBA cut rates following the global dot-com bust. By 2004, every capital city had roughly doubled from its 1996 starting point. Sydney led, but Brisbane, Adelaide and Melbourne were all close behind. This was the last cycle in which all seven cities moved largely in unison.
The mining boom rewrites the map
Western Australia’s iron ore and LNG boom transformed Perth from a mid-tier market to briefly Australia’s second most expensive city by 2006. Darwin followed the same arc. For a period in 2006 to 2008, Perth’s median house price exceeded Melbourne’s, a fact that surprises many people today. The Global Financial Crisis brought this to a sharp halt. Perth fell quickly from its peak. The RBA’s emergency rate cuts then ignited a new boom in Sydney and Melbourne that Perth would not join for another decade.
The two-speed city era
For most of the 2010s, Australian property was really two separate stories. Sydney and Melbourne ran hot, driven by population growth, constrained supply, and record low interest rates, while Perth and Darwin tracked the collapse of commodity prices into steady multi-year declines. Brisbane, Adelaide and Hobart largely flatlined through this period, underperforming inflation in real terms. Regulators eventually stepped in: APRA’s tightening of investor lending in 2017 caused Sydney and Melbourne to correct sharply through 2018 and 2019, bringing the decade of two-speed growth to a close.
COVID and the great repricing
Emergency interest rates of 0.1%, the federal HomeBuilder grant, and a widespread shift in how Australians valued space triggered the fastest national price growth on record. Every city surged. Brisbane, Adelaide and Perth, long dismissed as affordable but slow, suddenly attracted massive interstate migration. Hobart, already mid-boom from lifestyle migration, reached prices few had thought possible for a city of its size. The cities that had underperformed for a decade suddenly outperformed, and the convergence that began here has permanently reshaped the national affordability map.
Rate shock, resilience, and a new order
The RBA’s 13 rate rises in 18 months were expected to trigger a severe correction. Sydney and Melbourne did fall meaningfully. But Brisbane, Perth and Adelaide barely paused. By 2026, Perth and Brisbane had surpassed Melbourne in median house price, something that would have seemed impossible a decade earlier. The data now shows a fundamentally different national price map: the era of Sydney and Melbourne dominance has given way to a more distributed, multi-speed market where affordability, population growth, and economic diversification drive outcomes more than proximity to a CBD.
The headwinds aren’t new
Every single cycle in this chart had a compelling reason why property was about to fall and stay fallen. In 1990, mortgage rates hit 17% and economists predicted a decade of stagnation. The 2003 boom was widely called a bubble. The GFC in 2008 was supposed to be the end. The mining bust in 2014 triggered genuine multi-year declines in Perth and Darwin, and even then, both cities eventually recovered and exceeded their prior peaks.
The current headwinds, including affordability constraints, elevated rates, geopolitical uncertainty, and construction cost pressures, are real. They are also variations of headwinds that have appeared in every decade of this data. Behavioural finance research consistently identifies recency bias as one of the most costly mistakes long-term investors make: overweighting what is happening right now and underweighting the full historical pattern. The 30-year view doesn’t predict the future. It provides a more honest frame for reading the present.
What the data actually shows
cycle
FROM KNOWLEDGE TO ACTION
Understanding the cycle is step one
Knowing the history is necessary. Knowing what to do with it, for your specific situation, your timeline, your goals, is the harder part. Many people who understand property cycles well still delay action because they’re navigating it alone.
MSH is a free education and accountability community built around exactly that gap. Members work through the Wealth Pillar together: tracking goals, sharing research, and building the habits that turn understanding into decisions.
Join MSH free →Free membership. No spam. No financial advice.
Everything you read here is written to inform and inspire, not to replace the guidance of a professional. Mentor Sync Hub is an education and accountability community, not a financial advisory service, and we don’t hold an Australian Financial Services Licence. For anything financial, please speak with a licensed financial adviser and a registered tax agent before acting on what you read. For health and fitness topics, always check with your doctor or a qualified health professional. For career and networking strategies, results will depend on your individual effort and circumstances. We’re here to help you take action, but the right action for you is something only you (and the right professionals) can determine.