
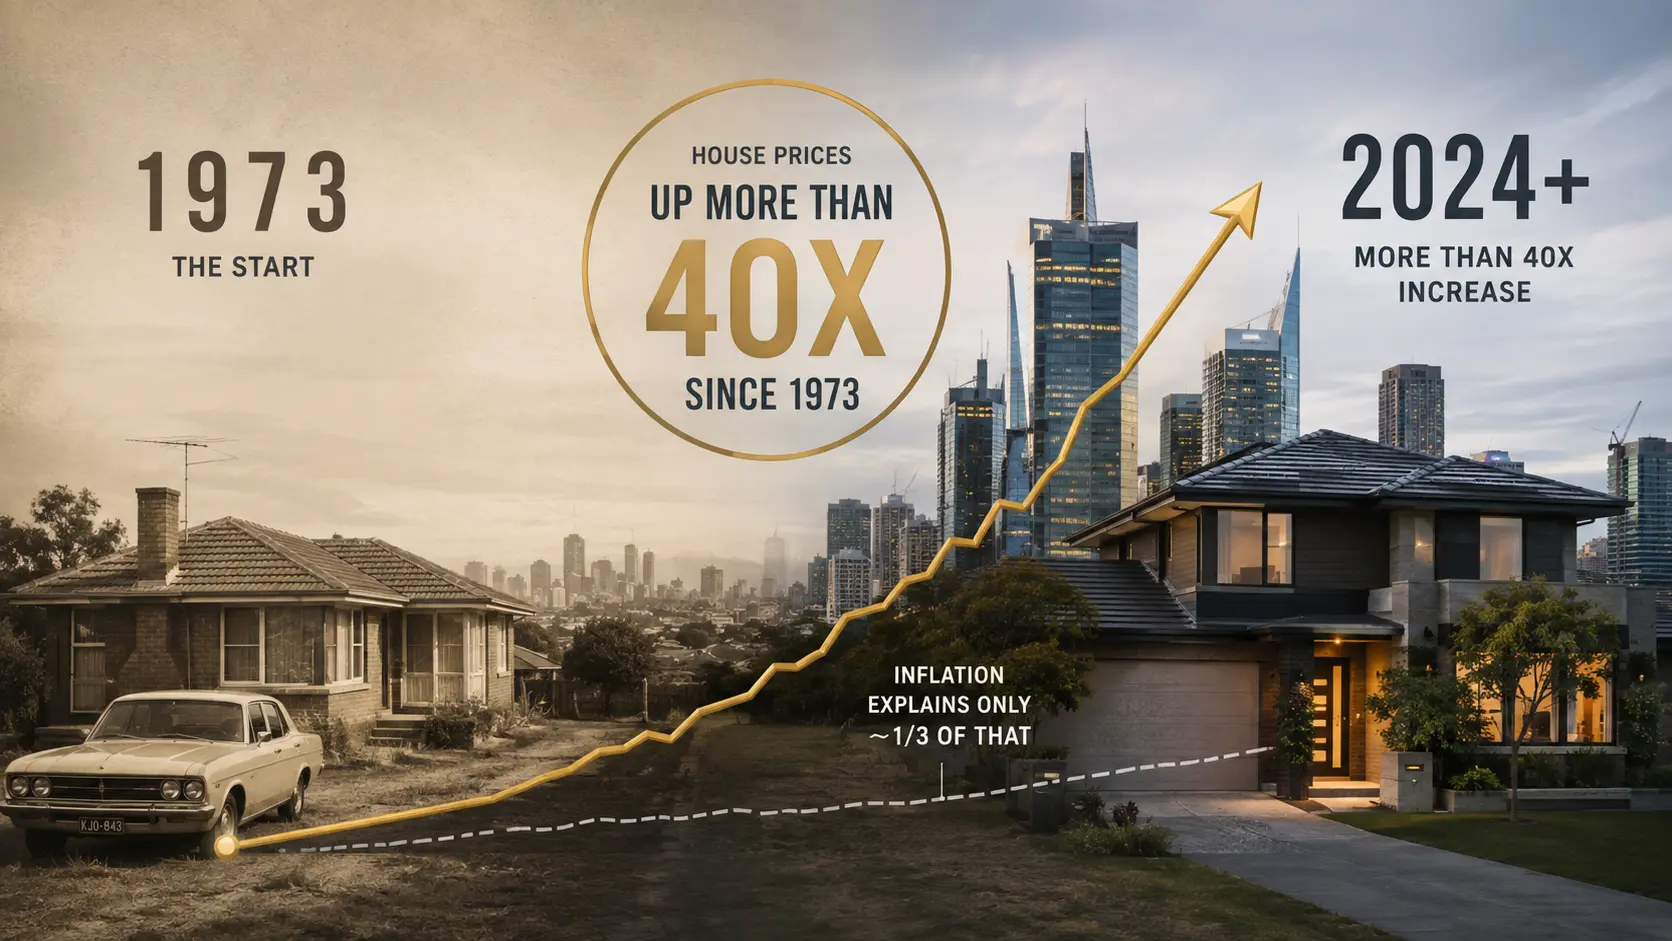
Australian House Prices Are Up More Than 40 Times Since 1973: Inflation Only Explains a Third of That
What five decades of price data actually shows, laid out plainly.
A median Australian capital city house that sold for around $21,400 in 1973 is, today, worth a figure roughly 40 times higher in raw dollar terms. That’s the number that gets repeated at barbecues and in headlines.
Here’s the part that’s reported far less often: general prices, everything from bread to petrol to rent, also rose sharply over the same 50 years, by around 12 times. Strip that out and the picture left over is still a strong one, just a very different sized number.
This article lays out the nominal figures, what’s left once inflation is removed, which decades produced the biggest real gains, and how differently that growth played out city by city.
Why You Should Care
“House prices have gone up X times” is one of the most repeated statistics in Australian property conversation, in the media, at family dinners, in real estate marketing. Almost all of those figures are quoted in nominal dollars, meaning they include the effect of general inflation. Knowing what portion of that number is inflation and what portion is genuine growth changes how every future headline like this reads.
Five Decades, Reported in Numbers
The headline figure, and what’s left after inflation
Australian capital city house prices rose from around $21,400 in 1973 to a figure roughly 43 times higher in nominal dollars today. Over the same period, general prices as measured by the Consumer Price Index rose by roughly 12 times. Dividing one by the other leaves a real, inflation-adjusted increase of roughly 3.5 to 4 times over 50 years.
The growth wasn’t a straight line
The real (inflation-adjusted) gain didn’t accumulate steadily year on year. Long-run price data shows it arrived in distinct bursts: the second half of the 1980s, the second half of the 1990s, the decade from 2000 to 2010, and the sharp run between 2020 and 2022. Between those periods, real prices were recorded as flat for extended stretches, including most of the first half of the 1980s, the first half of the 1990s, and much of the 2010s.
The story looked different in every city
National figures hide large differences between capitals. Between 1980 and 2003, real prices in Sydney, Melbourne, Brisbane, Adelaide and Canberra all more than doubled, while Perth and Hobart recorded much smaller gains over the same stretch. That pattern then reversed: on one long-run index, Hobart recorded the strongest real growth of any capital city between 2003 and 2022, a period during which Sydney’s earlier lead had largely flattened out.
Where to Check These Numbers Yourself
All of the figures above come from published sources that anyone can look up directly:
- The Reserve Bank of Australia’s inflation calculator converts any past dollar figure into today’s money, useful for checking any historical price against current terms.
- The ABS Residential Property Price Index publishes the price data by individual capital city, going back several decades.
- The RBA’s statistical tables include long-run housing price series alongside the inflation data used to calculate real growth.
- The ABS Consumer Price Index release shows exactly what “inflation” is measuring in any given quarter.
- Each of these sources publishes historical data by city and by quarter, so the same nominal-versus-real comparison above can be run for any specific location or year.
The Bottom Line
Over the past 50 years, Australian property has delivered a real, inflation-adjusted gain of roughly 3.5 to 4 times, well above simply keeping pace with the cost of living, and that growth arrived unevenly, in bursts, and differently from city to city. None of it was guaranteed in advance, and as with any historical data series, past performance is never a guarantee of what the next 50 years will look like.
If you want to keep building the habit of checking the numbers behind the headlines, alongside a community doing the same, MSH is a free space built around exactly that.
Join MSH Free