
Australia’s Property Market Just Split in Two: The FY2027 Forecast in 2 Minutes
Same country, opposite forecasts: tap through to see what’s behind your city’s numbers.
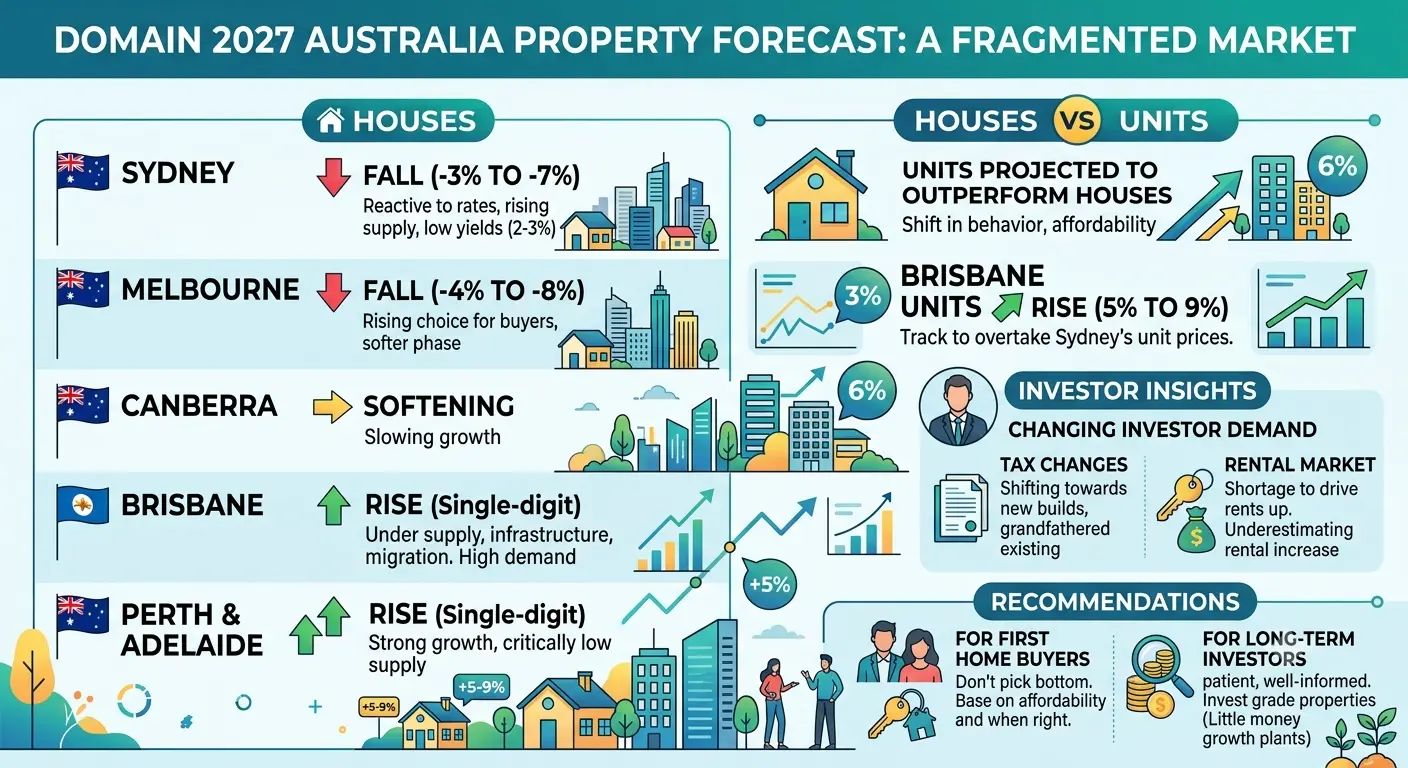
The “Australian property market” doesn’t move as one thing anymore. Domain’s new FY2027 Forecast Report tips prices to fall in some capital cities and keep climbing in others, in the very same year, driven mainly by a 7 to 8 per cent hit to borrowing capacity from recent rate rises.
Tap any city or driver below for the detail behind it, or just skim the headlines. Either way, five minutes gets you the full picture.
Why you should care: reading only the national headline can put you in the wrong city’s story. Assume it’s all falling and you might miss growth conditions at home; assume it’s all rising and you might walk straight into oversupply.
The forecast at a glance
Domain’s city-by-city figures, FY2027 (source: Domain FY2027 Forecast Report)
Highly reactive to rate rises because of large average loan sizes. A fast build-up of listings is shifting negotiating power to buyers, and gross rental yields sit low at 2 to 3 per cent.
Source: Domain FY2027 Forecast Report
An already well-supplied market is seeing a further build-up of stock, reducing buyer urgency and adding to the largest forecast falls of any capital.
Source: Domain FY2027 Forecast Report
Mirroring the softer, supply-driven dynamics playing out in Sydney and Melbourne, rather than a distinct trend of its own.
Source: Domain FY2027 Forecast Report
Protected by chronic undersupply, major infrastructure spending, and steady interstate migration. Units here are forecast to grow 5 to 9 per cent, on track to overtake Sydney as the most expensive unit market in the country.
Source: Domain FY2027 Forecast Report
Decelerating from previous 20%+ annual growth spikes, but still firmly insulated by critically low inventory levels.
Source: Domain FY2027 Forecast Report
A “crash” is typically defined as a fall over 20%, a “correction” as over 10%. These forecasts sit well inside normal cycle territory.
Many people track the Reserve Bank’s own cash rate decisions directly rather than relying on the headline summary, since borrowing capacity is the biggest lever behind these numbers.
What’s driving the split
Tap a switch to see the forces pulling each side, from Domain’s FY2027 Forecast Report
Consecutive rate rises have cut typical borrowing capacity by a cumulative 7 to 8 per cent, lowering what buyers can bid.
More stock on market, on top of an already well-supplied Melbourne, is reducing buyer urgency and adding negotiating power.
Shifting tax treatment toward new builds over existing dwellings is changing how and where investors deploy capital.
Years of constrained new housing supply are keeping upward pressure on prices in Brisbane, Adelaide and Perth.
Massive committed infrastructure spending is underpinning confidence and demand, especially in Brisbane.
Consistent net inflows of people are steadily adding to housing demand ahead of new supply.
Many buyers check ABS interstate migration data for their state before assuming demand will hold, since population flow is one of the clearest early signals behind these forecasts.
Units vs houses, and what history says
Units are forecast to outperform houses in most capitals. In Sydney, a house now costs 111 per cent more than a unit on average, pushing buyers toward location over land size. Brisbane units are forecast to grow 5 to 9 per cent, on track to overtake Sydney as the country’s most expensive unit market.
Zooming out, Domain’s own cycle data since the mid-1990s shows the average downturn lasts under a year and dips 2.9 per cent, while the average upswing runs 2.8 years and delivers 32.3 per cent growth.
For readers who want to turn any of these percentages into real numbers, ASIC’s Moneysmart mortgage calculator is a common starting point, free and independent of any lender.
Common first steps
- 1A common first step is checking the RBA’s rate decisions directly rather than the headline summary.Free, today
- 2Many buyers compare listing volumes for their specific suburb, since supply varies block to block.
- 3Some investors check gross rental yield for their target area rather than a city-wide average.
- 4A common approach when weighing house vs unit is comparing the local price gap against what each option buys in location.
- 5A frequent free action this week is running your own numbers through Moneysmart’s mortgage calculator.Free, this week
A split market rewards people who look at their own city and their own numbers, not the national headline. Waiting for a clear “bottom” has historically cost more than it protects, since recoveries tend to arrive before the confidence to act on them does.
Build the habit, not just the knowledge
If you want to build habits like tracking rate decisions and running your own numbers alongside others doing the same, MSH is a free community built around exactly that.
Join free here